I’m pleased to announce the initial beta launch of our simple metrics service which makes a selection of graphs available for Cloud Servers, Cloud SQL Instances and Volumes within the Control Panel.
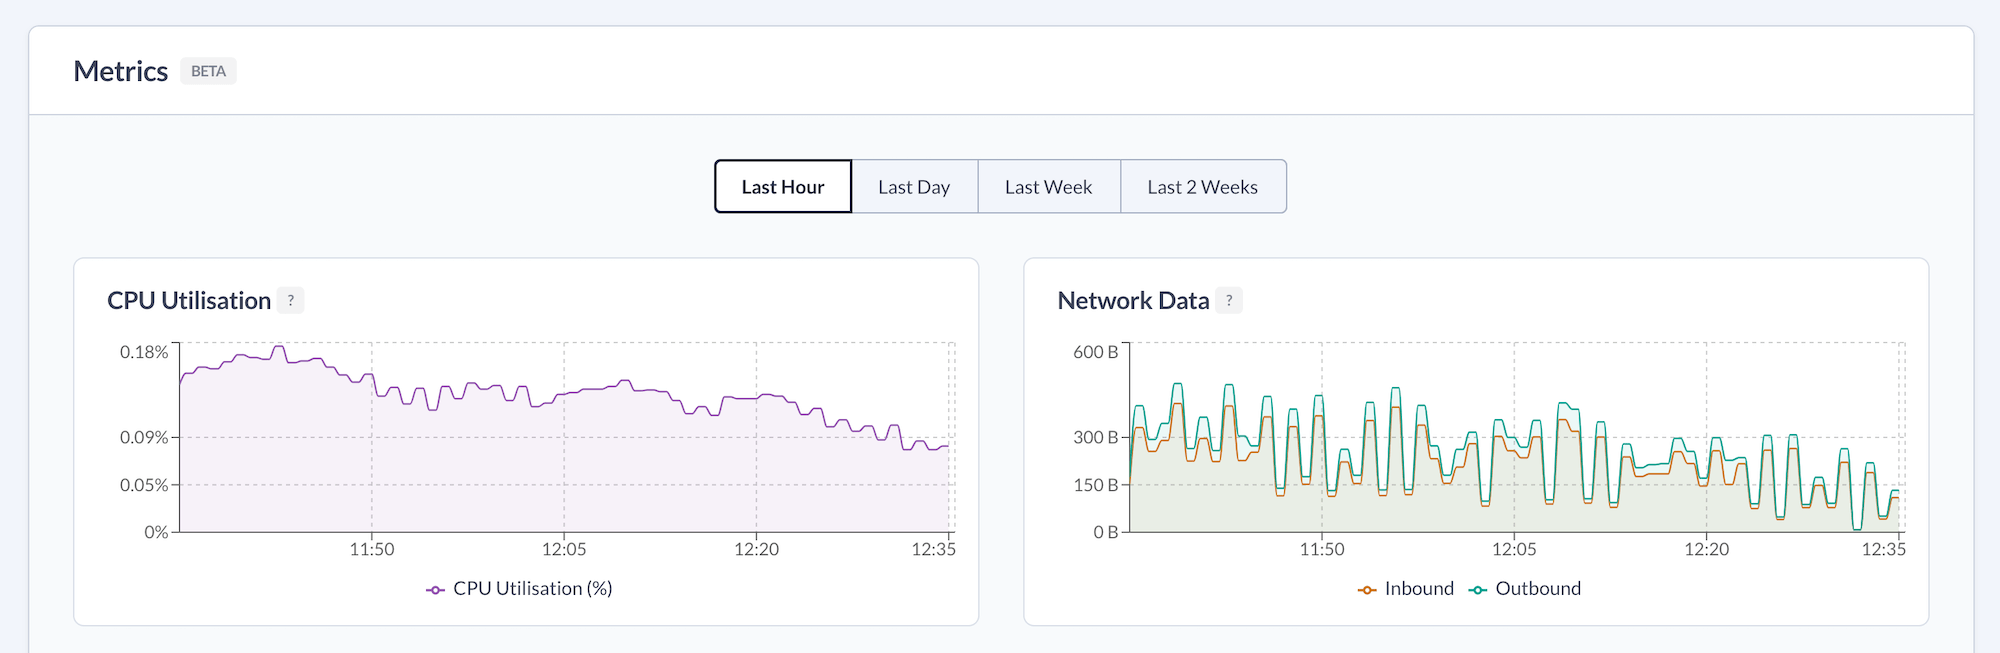
There’s no additional cost for these new metrics and you don’t need to do anything to enable them – they are collected and viewable automatically within the normal resource view in Control Panel with graphs for the last hour, last day (24 hours), last week and last two weeks.
Many customers implement their own metrics/monitoring solution for deployments as a matter of course, but sometimes it’s useful to be able to quickly check a graph to help identify potential performance issues without having to setup and maintain the infrastructure.
The following metrics are currently available.
There are number of features on the roadmap for our metrics service. Of course, if there’s something you’d like to see, do let us know and we’ll look into it.
If you’re an existing customer you can log in to Control Panel and view the graphs now. If you’re not yet a customer, why not create an account and get a £50 credit to try us out.