Brightbox enables you to build scalable applications very quickly, by creating a number of cloud servers and placing them behind a cloud load balancer, but, how do you know how much traffic you are going to be able to handle?
Benchmarking single cloud servers using something like the Apache benchmark tool (ab) is fairly straightforward, but this only allows very simple testing to be performed and we soon become limited by the upstream bandwidth of our testing host. To test a clustered application we can use a distributed load testing tool like tsung.
First, on a Debian or Ubuntu host, we’ll install the required Erlang dependencies, along with some packages we can use later for building reports:
apt-get install erlang gnuplot libtemplate-perl
Once the dependencies are installed we can install tsung itself directly from the latest release like so:
wget http://tsung.erlang-projects.org/dist/tsung-1.5.1.tar.gz
tar zxvf tsung-1.5.1.tar.gz
cd tsung-1.5.1
./configure && make && make install
Note: There is a tsung package available for both Debian and Ubuntu, but using it can cause problems with mixed erlang versions.
Although tsung can be executed on a large number of servers we’ll keep this introduction simple, and just demonstrate testing from a pair of cloud servers.
Tsung communicates between testing nodes using SSH, so make sure your SSH keys are installed on the servers and that you can SSH between them without a password prompt.
Tests are configured using an XML file, which is then executed to produce a series of output files. From these output files a graphical report can be created which will allow you to see how your cloud servers are performing.
The following is an example of a simple configuration file which requests the URL http://example.com/index.html from the two nodes which are named ts1 and ts2:
<?xml version="1.0"?>
   <!DOCTYPE tsung SYSTEM "/opt/local/share/tsung/tsung-1.0.dtd">
   <tsung loglevel="warning">
   <clients>
      <client host="ts1" cpu="2" maxusers="30000000"/>
      <client host="ts2" cpu="2" maxusers="30000000"/>
   </clients>
   <servers>
      <server host="www.example.com" port="80" type="tcp"/>
   </servers>
   <load>
      <arrivalphase phase="1" duration="1" unit="minute">
         <users arrivalrate="5" unit="second"/>
      </arrivalphase>
    </load>
   <sessions>
      <session name="es_load" weight="1" type="ts_http">
         <request>
            <http url="/index.html" method="GET"/>
         </request>
      </session>
   </sessions>
 </tsung>
We then launch the test, specifying the XML file, like so:
root@ts1:~# tsung -f example.xml start
Starting Tsung
"Log directory is: /root/.tsung/log/20141107-1047"
This will output a number of files in the named directory, and we can then create a graphical report of the results using a companion utility which was installed alongside tsung:
root@ts1:~# cd /root/.tsung/log/20141107-1047
root@ts1: # /usr/lib/tsung/bin/tsung_stats.pl
Here are a couple of examples of the kind of output you can expect to see, showing mean transaction times, along with the time taking to establish and process requests:
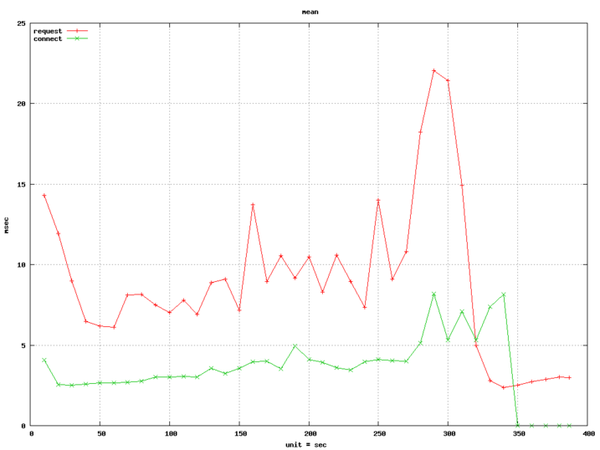
The key to tsung is that you specify the rate of arrival of clients, and how long they remain, rather than specifying the number of simultaneous connections explicitly.
There are many more things you can do with tsung, such as randomly choose URLs to visit from a small list, or an input file, and perform different types of requests. These options are discussed in the Tsung user manual, which is worth reading if you’d like to explore tsung further.
Have you got any top tips for using tsung? Do let me know in the comments below.